What Is Data Visualization?
Leave a CommentUnderstanding Data Through Visual Representation

Introduction
In a world overflowing with information, making sense of large and complex datasets can be challenging. Data visualization is the key to unlocking insights and understanding from raw data. But what exactly is data visualization, and why does it matter?
Defining Data Visualization
Data visualization is the graphical representation of information and data. By using visual elements like charts, graphs, maps, and infographics, data visualization tools help people see and understand patterns, trends, and outliers in data.
Instead of sifting through endless rows of numbers or text, data visualization allows us to interpret data quickly and efficiently, making complex information accessible and actionable.
Why Is Data Visualization Important?
- Clarity: Visual representations clarify complex data, making it easier to comprehend.
- Efficiency: Humans process visual information faster than text or numbers, so visuals speed up data analysis.
- Decision-Making: Well-designed visualizations reveal trends and correlations, supporting informed decisions.
- Communication: Data visualizations aid in presenting findings to others, whether in business, science, or education.
Examples of Data Visualization
Common types of data visualization include:
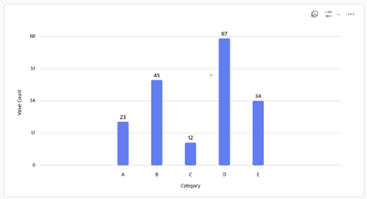 Bar Charts: Compare quantities across categories.
Bar charts are especially useful in data visualization because they present categorical data in a straightforward, easily interpretable format. The length of each bar makes it simple to compare values side by side, highlighting differences and similarities among categories at a glance. Additionally, bar charts can reveal patterns such as the highest or lowest values, making them ideal for identifying trends or outliers within a dataset.
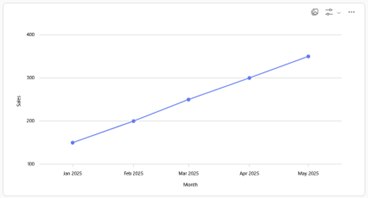 Line Graphs: Show changes over time.
Line graphs are particularly valuable in data visualization because they effectively illustrate trends and changes over time. By connecting individual data points with lines, these graphs make it easy to observe upward or downward movements, spot cycles, and identify patterns such as peaks, valleys, and periods of stability. This makes line graphs ideal for tracking metrics like sales, temperature, or stock prices, helping users quickly assess historical performance and forecast future outcomes.
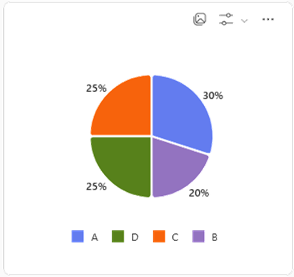 Pie Charts: Display proportions of a whole.
Pie charts are useful in data visualization because they offer a clear and immediate visual representation of how different parts contribute to a whole. By displaying each category as a slice, pie charts make it easy to compare proportions and see which segments are dominant or minor within a dataset. They are especially effective when illustrating percentage breakdowns, helping audiences quickly grasp relative sizes and distributions without needing to interpret complex numbers.
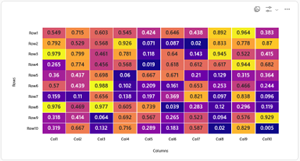 Heat Maps: Represent data values using color intensity.
Heat maps are useful in data visualization because they allow viewers to quickly identify patterns, trends, and anomalies in large datasets by leveraging color gradients. The intensity of color makes it easy to spot areas of high or low concentration, which is especially helpful when analyzing complex information like website activity, geographic data, or correlations between variables. This intuitive visual approach enables users to grasp distributions and relationships at a glance, making decision-making and deeper analysis more efficient.
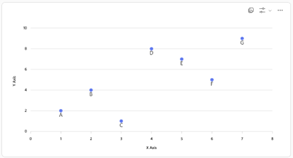 Scatter Plots: Show relationships between two variables.
Scatter plots are valuable in data visualization because they reveal the relationship between two variables, making it possible to detect correlations, clusters, or outliers within a dataset. By plotting individual data points on a two-dimensional graph, scatter plots help users see how changes in one variable may be associated with changes in another, which is essential for identifying patterns, trends, or potential causation. This visual approach is particularly useful for exploratory data analysis, statistical modeling, and understanding complex interactions between variables.
Each type brings a unique perspective, allowing users to explore and interpret data in different ways.
Applications of Data Visualization
Data visualization is everywhere—from financial dashboards and scientific research to marketing reports and news media. Businesses use it to monitor performance, researchers to spot discoveries, and governments to inform the public.
Conclusion
Data visualization transforms raw data into meaningful insights by making information easy to see and understand. Whether for analyzing trends, spotting anomalies, or communicating complex concepts, data visualization is an indispensable tool in today’s data-driven world.