Blog
Understanding Normal Distribution in Data Analysis
A Foundational Concept for Interpreting Data
What Is Normal Distribution?
In the world of data analysis, the term “normal distribution” comes up frequently—and for good reason. Normal distribution is a fundamental concept in statistics that helps analysts understand and interpret data patterns. But what exactly is it, and why does it matter?
The Basics of Normal Distribution
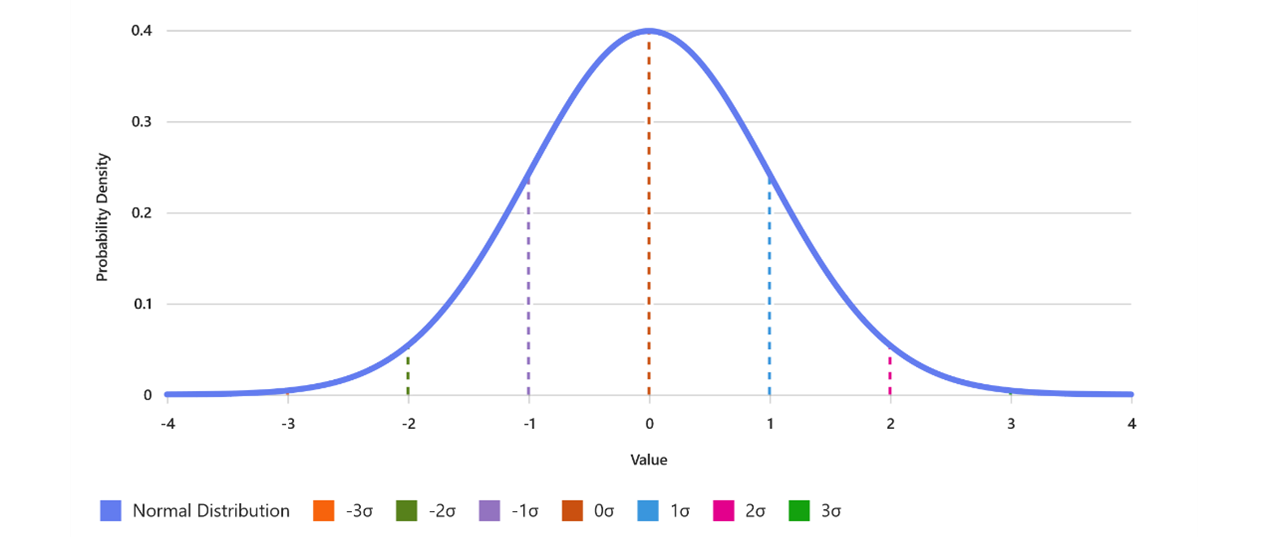
Normal distribution refers to a specific way that data values are spread out on a graph. Imagine plotting the values of a dataset—like the heights of a group of people—on a chart. If the data follows a normal distribution, the graph will take on the shape of a symmetrical, bell-shaped curve. This curve is highest in the middle, where most data points cluster around the average (mean), and it tapers off equally on both sides.
The normal distribution is also called the “Gaussian distribution,” named after mathematician Carl Friedrich Gauss. Its key features include:
- Symmetry: The curve is perfectly symmetrical around the mean.
- Mean, Median, and Mode: In a normal distribution, these three measures of central tendency are all equal and located at the center of the curve.
- Standard Deviation: The spread or width of the curve is determined by the standard deviation, which measures how far data points are from the mean.
Why Is Normal Distribution Important in Data Analysis?
Normal distribution is crucial because many statistical tests and methods assume that data follows this pattern. When data is normally distributed, analysts can use powerful techniques to make predictions, test hypotheses, and draw conclusions. For example, the normal distribution enables:
- Calculating Probabilities: Analysts can determine the likelihood of a value occurring within a certain range.
- Inferential Statistics: Tests like t-tests and ANOVA rely on the assumption of normality for their results to be valid.
- Data Transformation: Recognizing non-normal data allows analysts to apply transformations or choose alternative methods.
Real-World Examples
Many natural and social phenomena follow a normal distribution. Some classic examples include:
- Heights or weights of people in a population.
- Standardized test scores (like SAT or IQ tests).
- Measurement errors in scientific experiments.
Visualizing Normal Distribution
Picture a bell-shaped curve. The peak at the center shows the average, and most values cluster tightly around this point. As you move away from the center, values become less frequent, creating the tapered “tails” on either side. This visual helps analysts quickly understand the distribution of their data.
Conclusion
In summary, normal distribution is a cornerstone of data analysis, providing a foundation for statistical methods and insights. Recognizing this pattern in your data allows you to apply robust analytical tools and make informed decisions. Whether you’re assessing exam scores, measuring physical traits, or analyzing business metrics, understanding normal distribution is essential for accurate, reliable data analysis.